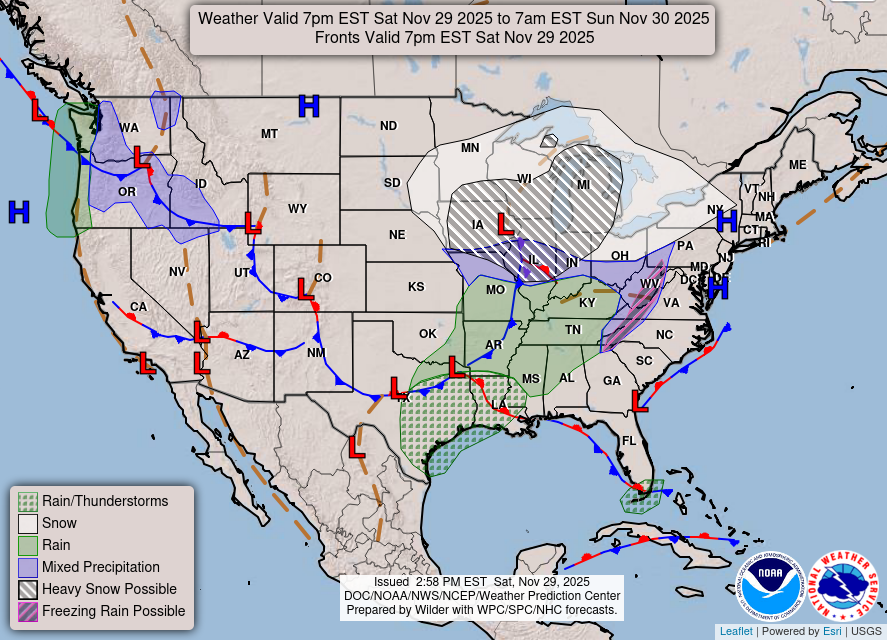
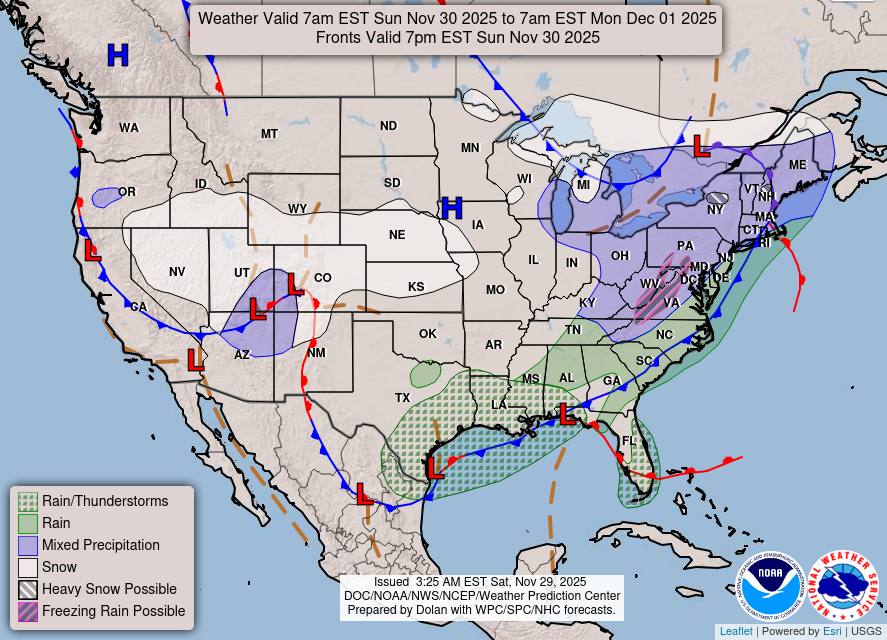
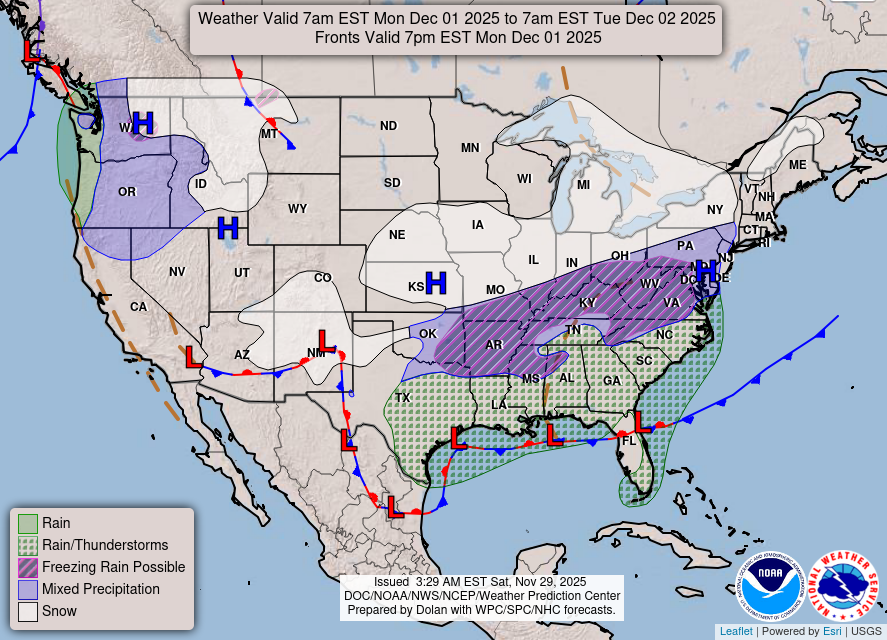
Each map ABOVE shows where precipitation is expected for a 24 hour period beginning 7 AM for the day and continuing through 7AM the following day. Fronts, highs and lows are positioned 7 PM Central Time of the same day listed.
———————————————–
Each map BELOW shows where fronts, highs and lows are positioned 7 AM Central Time of the same day listed.